

Statistics
Statistics gives you a live read on performance, split into three views. Every view follows the date range you pick at the top.
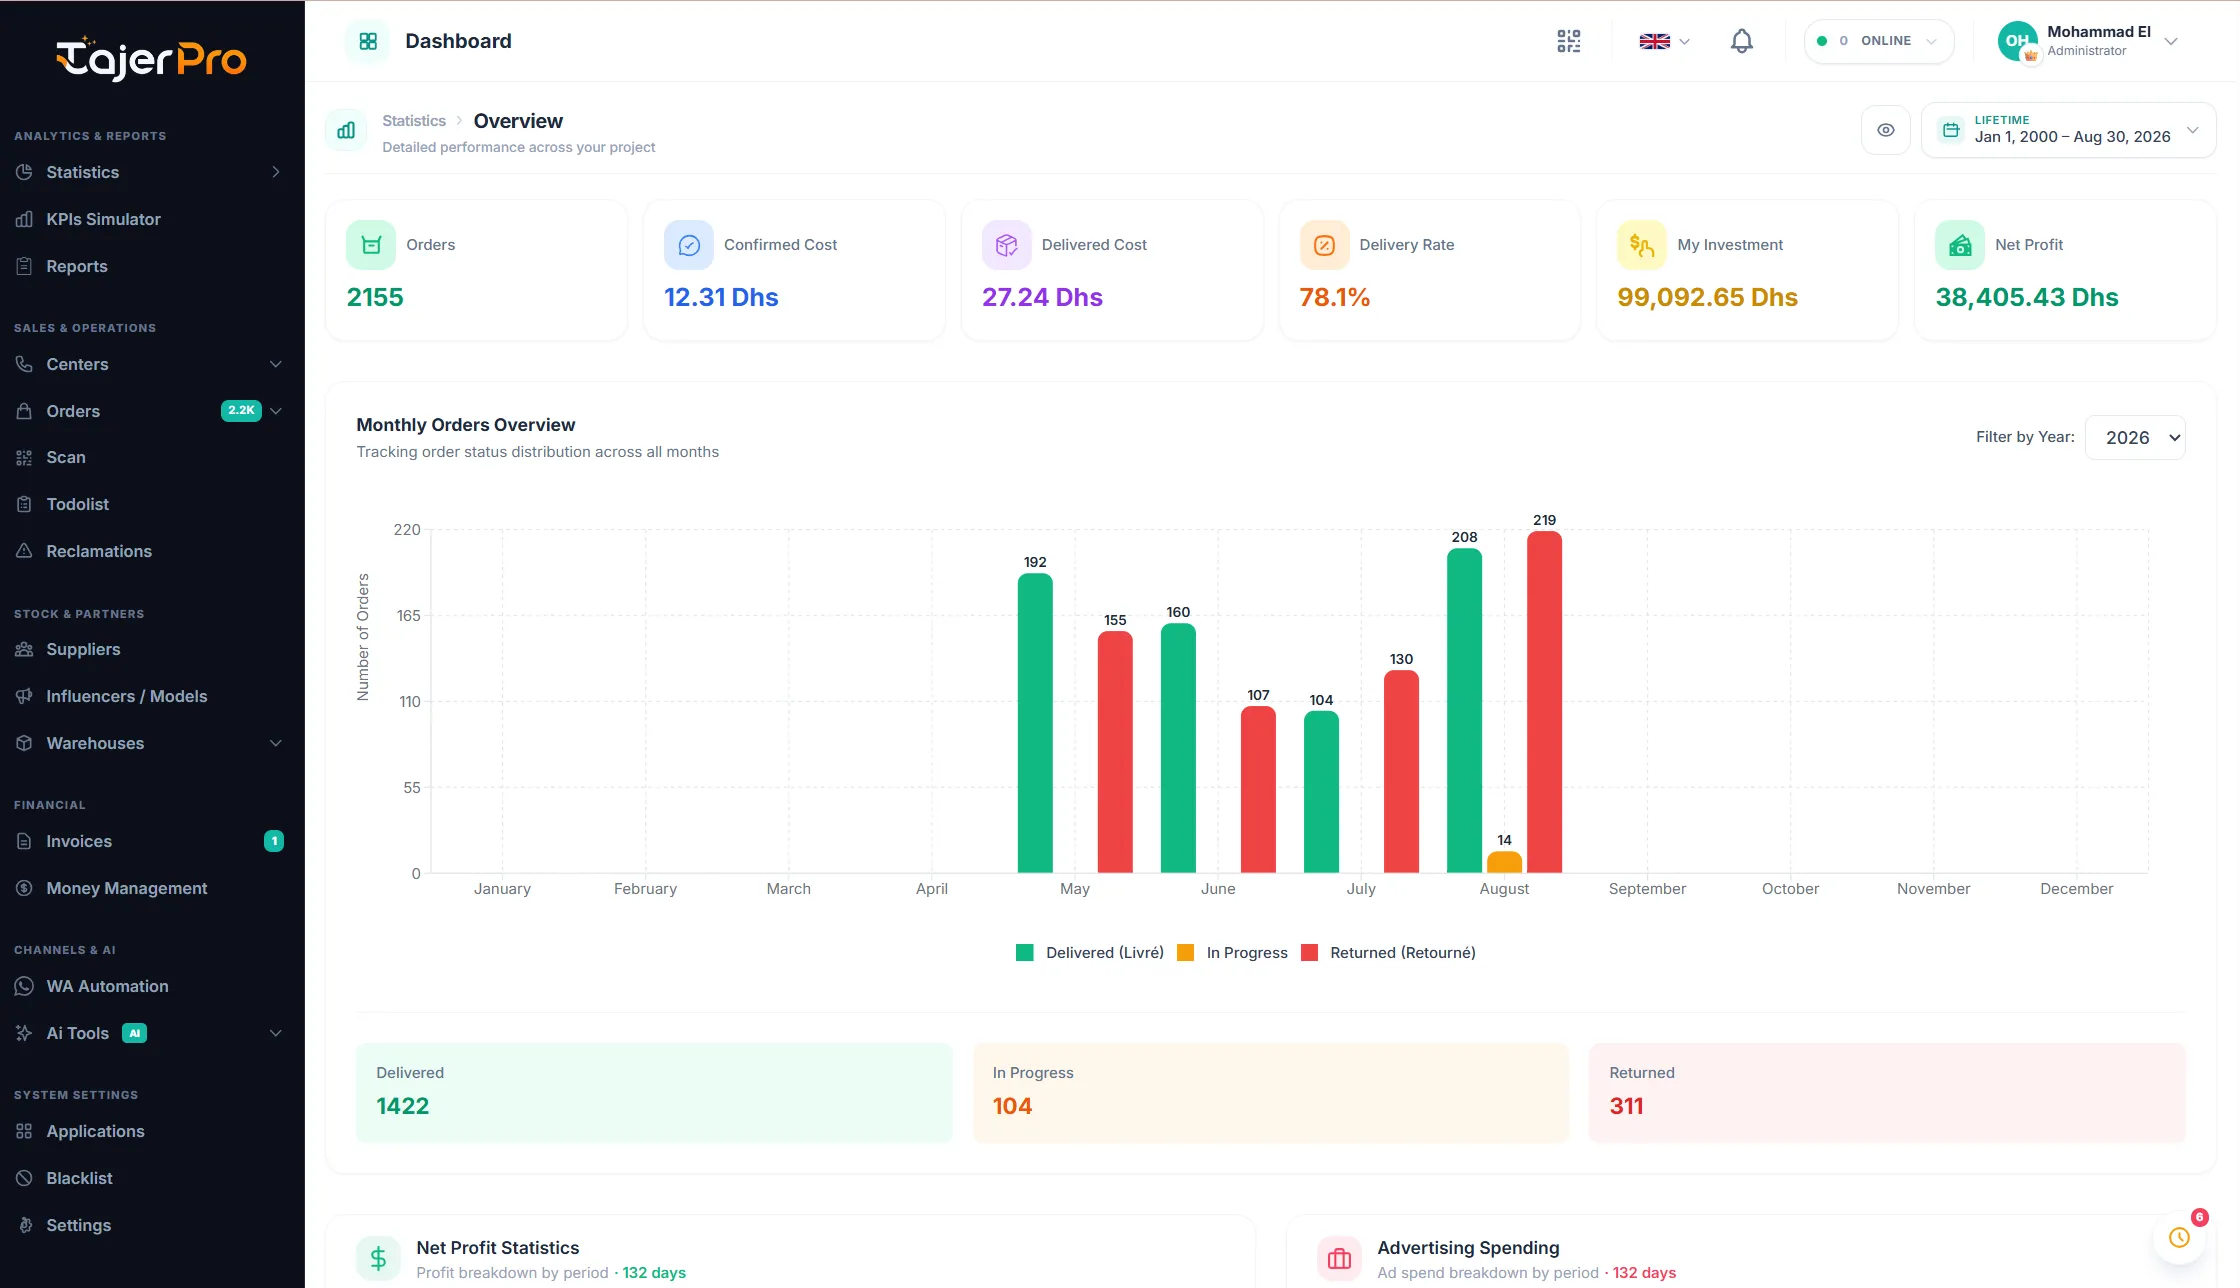
Overview
Section titled “Overview”The default dashboard: KPI cards (Orders, Confirmed Cost, Delivered Cost, Delivery Rate, My Investment, Net Profit), the Monthly Orders Overview chart, and Net Profit / Advertising Spending breakdowns. See The Dashboard.
Confirmation
Section titled “Confirmation”Focuses on the confirmation funnel — how many leads were received, confirmed and the resulting rates — so you can see how your confirmation team is performing over the period.
Delivery
Section titled “Delivery”Focuses on the delivery funnel — shipped, delivered, returned and the delivery rate — plus delivery-related costs, so you can track fulfilment quality.