

The Dashboard
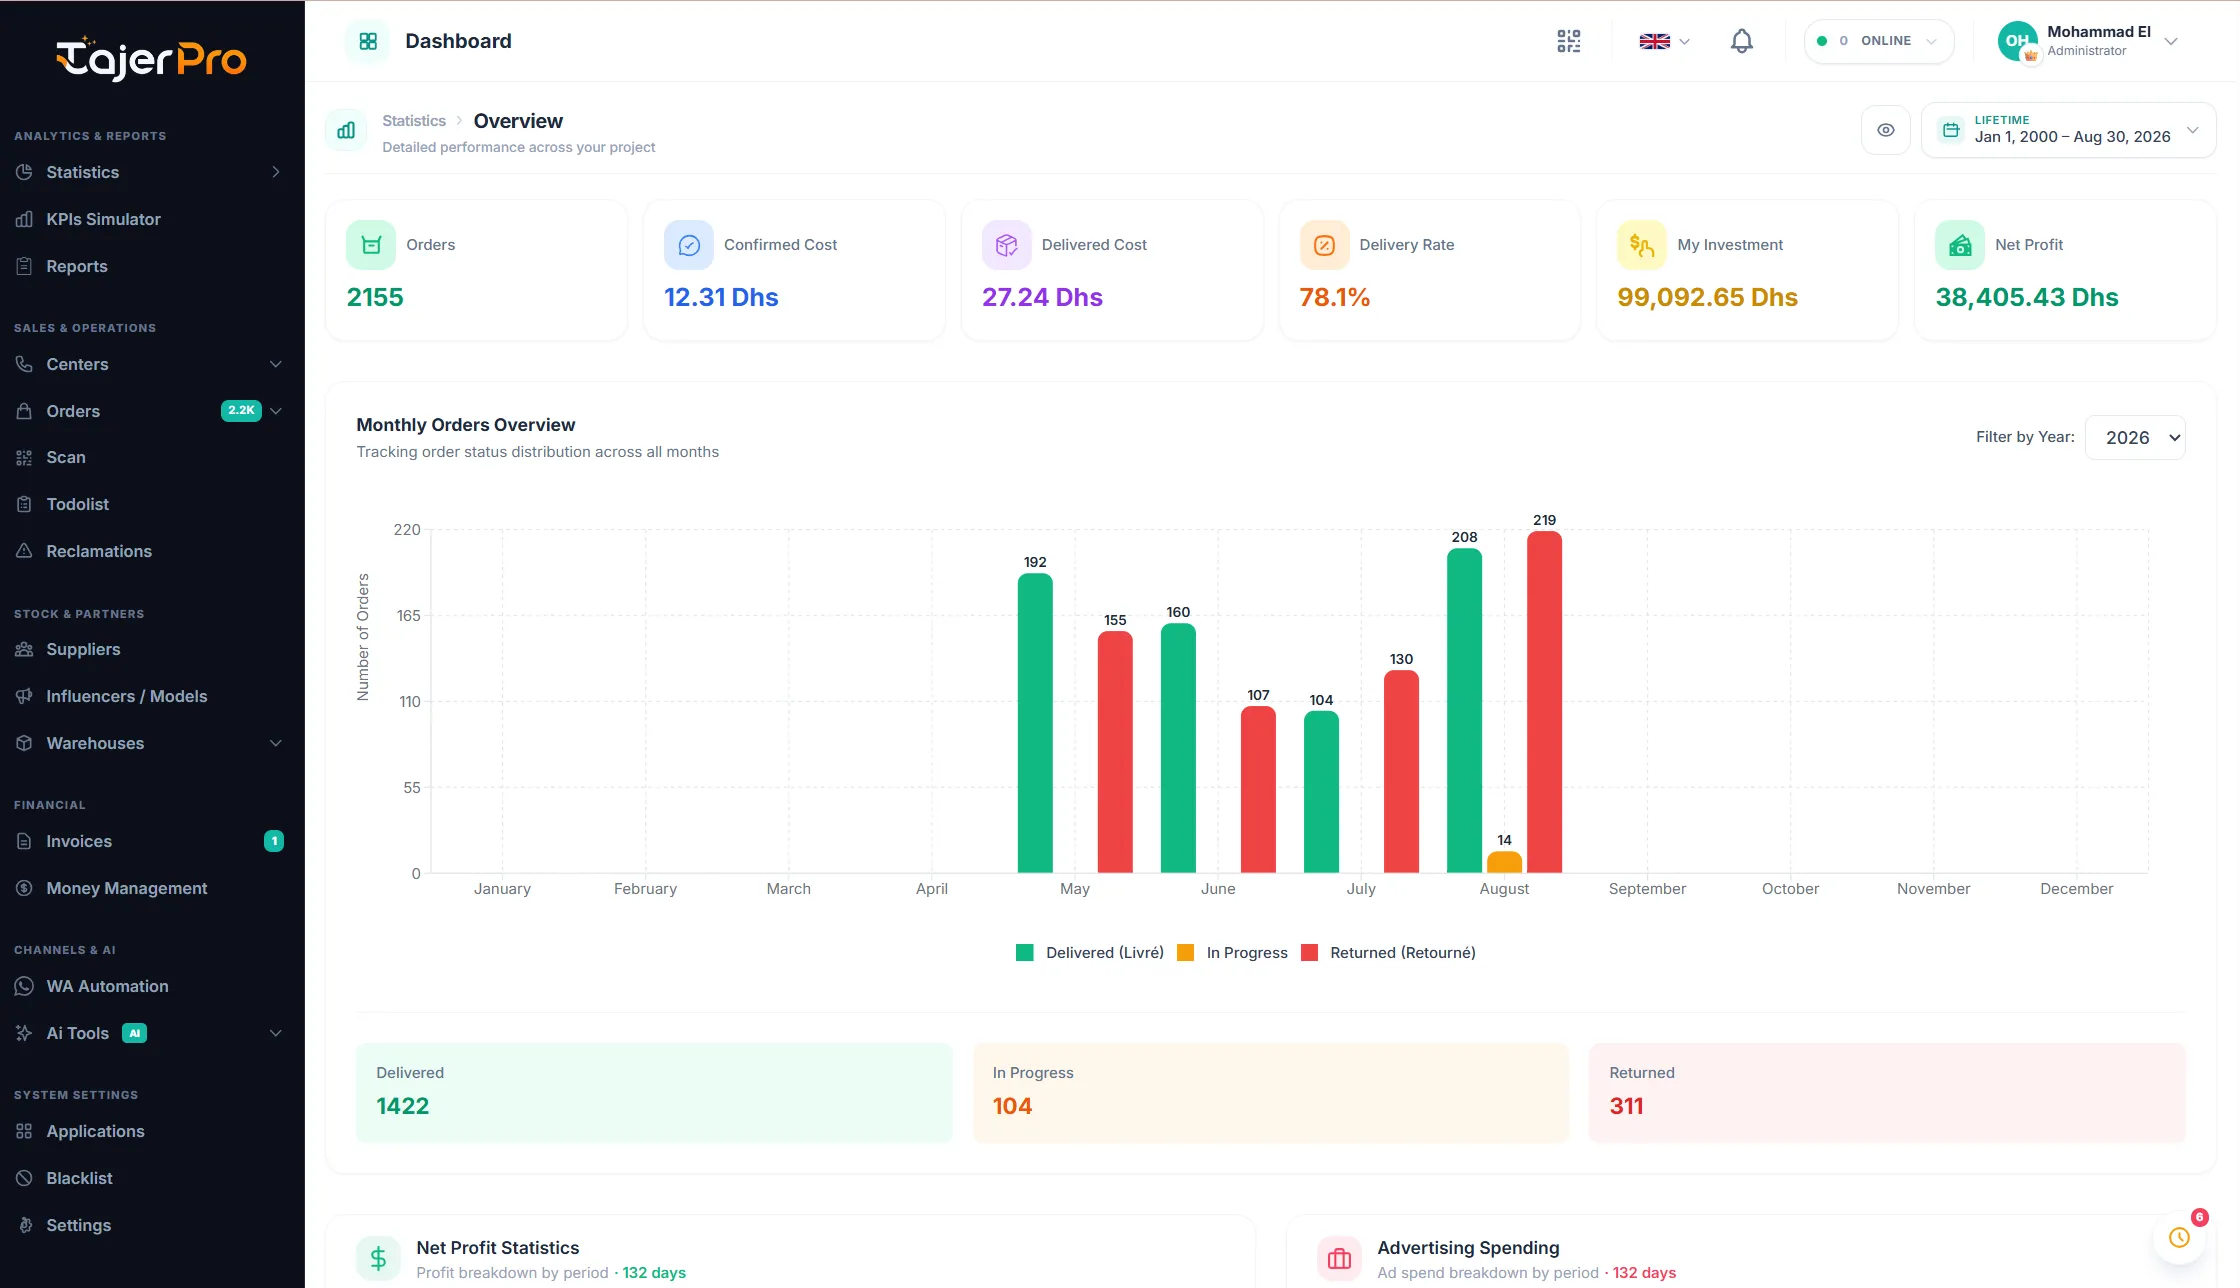
After you sign in, TajerPro opens on the Statistics → Overview dashboard: a live snapshot of your business.
What’s on the Overview
Section titled “What’s on the Overview”- KPI cards — Orders, Confirmed Cost, Delivered Cost, Delivery Rate, My Investment and Net Profit for the selected period.
- Monthly Orders Overview — a bar chart of Delivered / In Progress / Returned orders per month, filterable by year.
- Delivered / In Progress / Returned — headline counts for the period.
- Net Profit Statistics and Advertising Spending — profit and ad-spend broken down by day / week / month / period.
Use the date range picker (top right) to switch between Today, this week, this month, a custom range or Lifetime. Every number on the page follows the range you choose.
Finding your way around
Section titled “Finding your way around”- The sidebar (left) groups every page by area — Analytics & Reports, Sales & Operations, Stock & Partners, Financial, Channels & AI, and System Settings. See Navigation & Sidebar.
- The top bar shows the current page, a language switcher, notifications, your online status and your account menu.
- Other statistics views live under Statistics → Confirmation and Statistics → Delivery (see Statistics).